
FIG. 10.
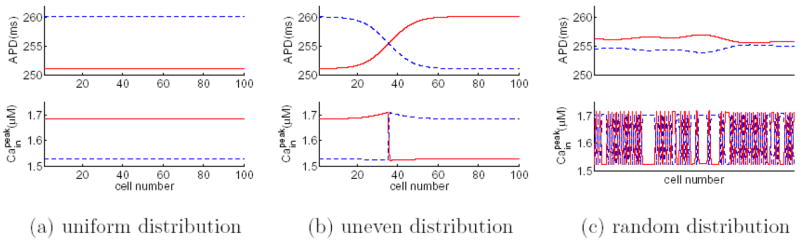
(Color online) Simulation of the coupled-maps model: three selected alternans solutions for a homogeneous fiber of 100 cells with negative Ca→Vm coupling. The pacing period is 375 ms in all panels. Panel (a) starts from a uniform initial distribution in Cain. Panel (b) starts from an initial condition, where Cain is set to be 1.5 μM in the first 35 cells and 1.7 μM in the remaining cells. Panel (c) starts from a random initial distribution in Ca. The last 10 beats of the steady-state solutions are plotted, where odd beats are represented by red solid lines and even beats by blue dashed lines.