
Fig 4. Integrated data from different cohorts of patients.
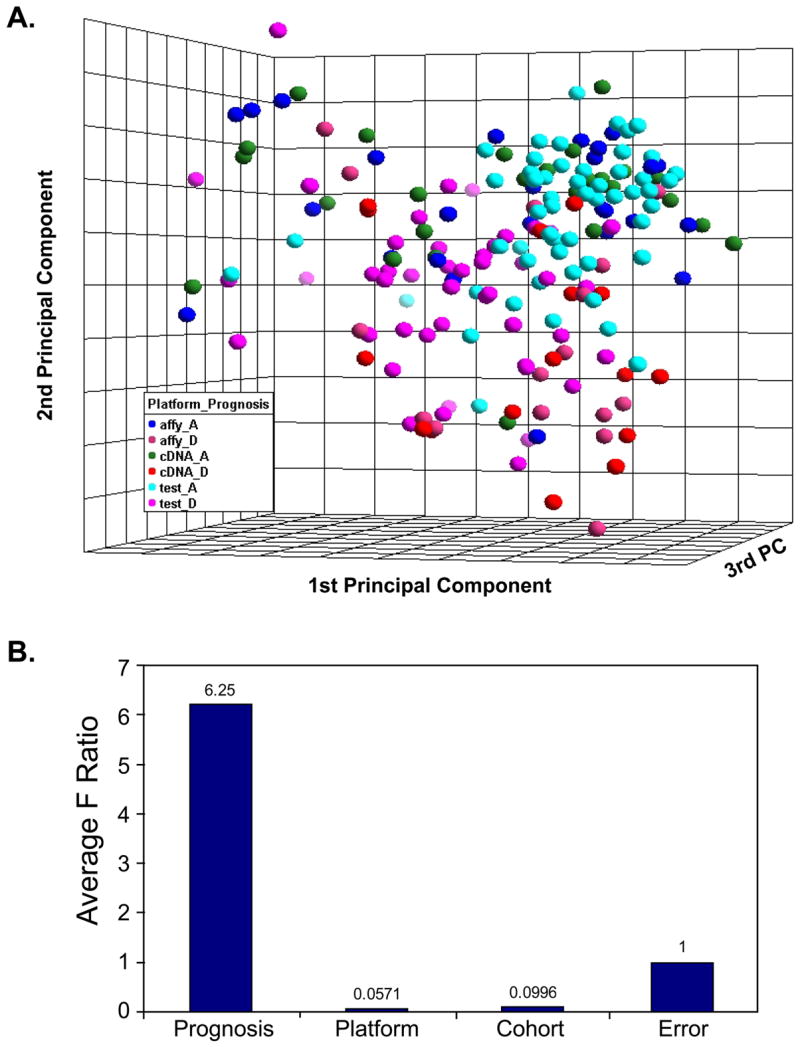
The datasets of 42 neuroblastoma samples on cDNA and Affymetrix platforms (84 experiments) and a dataset of 102 neuroblastoma samples produced on Affymetrix platform generated by a different lab [4] with a different cohort of patients were combined after the normalization and z-score standardization separately. A. Loading plot of top three principal components of the 186 experiments using all 12442 Unigenes demonstrates the separation of good prognosis from poor prognosis samples. Platform effect and patient cohort effect are not seen after standardization. The sample labels are shown as follows: for patient cohort and platform status affy= 42 neuroblastoma samples on Affymetrix, cDNA= 42 neuroblastoma samples on cDNA, test= 102 neuroblastoma samples on Affymetrix; for survival status A= alive and D= dead. B. The sources of variation in the ANOVA analysis. Prognosis has the highest variation.