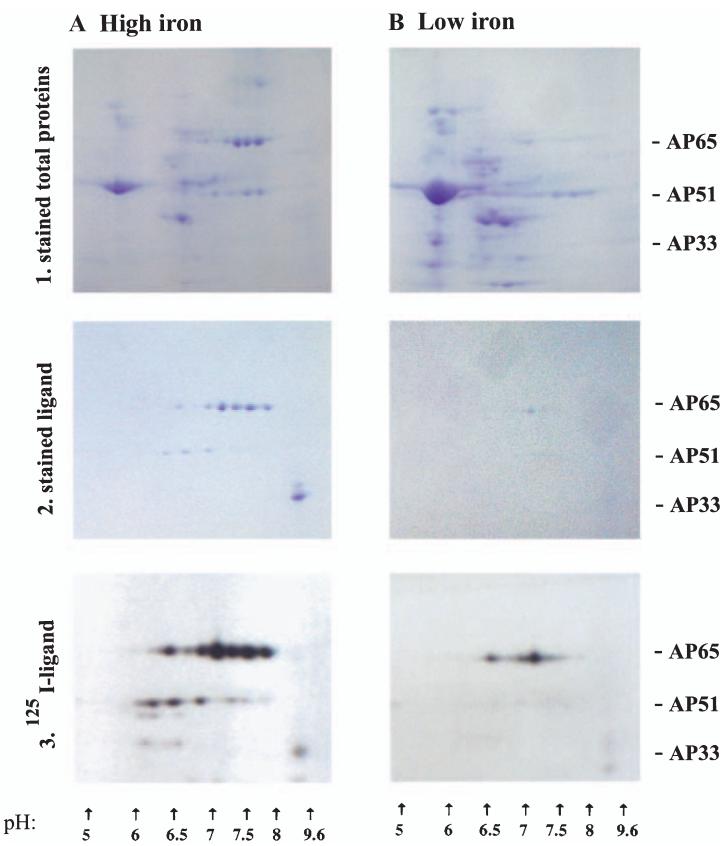
Fig. 5.
Combined ligand assay with two-dimensional SDS-PAGE confirms the surface residence of the adhesin family members. Isoelectric focusing separated the total proteins or proteins from the ligand assay in a pH 3-10 ampholine gradient followed by electrophoreses and staining or autoradiography. Part 1. Coomassie brilliant blue stained total protein patterns of the duplicate samples of surface-iodinated organisms used in Parts 2 and 3 below. Trichomonads were grown in high- (A) and low-iron medium (B). The complex patterns of proteins are representative of equivalent cell numbers treated identically, and the different patterns are indicative of the iron status of trichomonads. Part 2. Stained patterns of proteins following the ligand assay, which enriches for the host cell-binding proteins of extracts of parasites grown in high (A) and low-iron medium (B). The same number of cell equivalents was used in the ligand assays. Part 3. Autoradiogram patterns of the stained gels in Part 2 showing iodinated protein spots of the two-dimensional gels. The X-ray film was exposed 8 h for both samples handled identically. It is noteworthy that immunoblots of duplicate samples of the stained gels of part 2A were performed comparing the rabbit antisera to the adhesins with mAbs F11 (AP65) and F5 (AP33). Not unexpectedly based on results recently published for AP33 (Engbring and Alderete, 1998a), the patterns of antibody reactivities were identical with those seen here for AP65 and AP33.

