
Fig. 2.
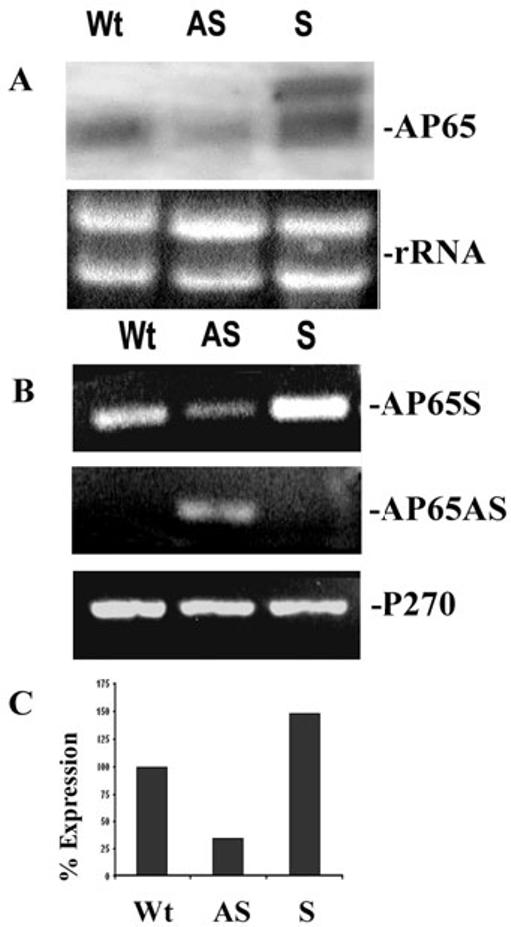
Levels of ap65 mRNA in antisense (AS) transfected trichomonads is less than transcript in the sense (S) and wild type (Wt) organisms.
A. Northern analysis was performed to detect levels of ap65 mRNA. The larger band in the S transfectants is of the ap65 transcript derived from the S plasmid. Using the Scion image β program and densitometric scanning of the bands indicates a 62% reduction of transcript in the AS transfectants. The rRNA bands are included as controls to show equivalent amounts of RNA added to the blots; however, the slightly increased intensity of the S ap65 transcript is the result of slightly higher amounts of sample added to the well. In this experiment, 10 μg total RNA in each lane was electrophoresed in 1.2% agarose-formaldehyde gels and blotted onto Hybond-P membranes. The blot was probed with DIG-labelled ap65 that hybridized to an approximately 2-kb endogenous ap65 transcript.
B. A representative experiment showing RT-PCR products for the ap65 sense transcript (AP65S) and the episomally expressed antisense transcript (AP65AS). RT-PCR was also performed using primers to amplify a 300-bp region of the p270 gene (P270) as a control. Equal volumes of the PCR reactions were separated on 1% agarose followed by staining with ethidium bromide.
C. Quantitation of amounts of PCR products in part A for the ap65 transcript in AS transfected parasites compared to S transfected and Wt organisms. The bar graph shows the relative amounts of the RT-PCR products for ap65. The amount of Wt ap65 transcript was normalized to 100%. As for Part A, quantitation was done using the Scion image β program and densitometric scanning.