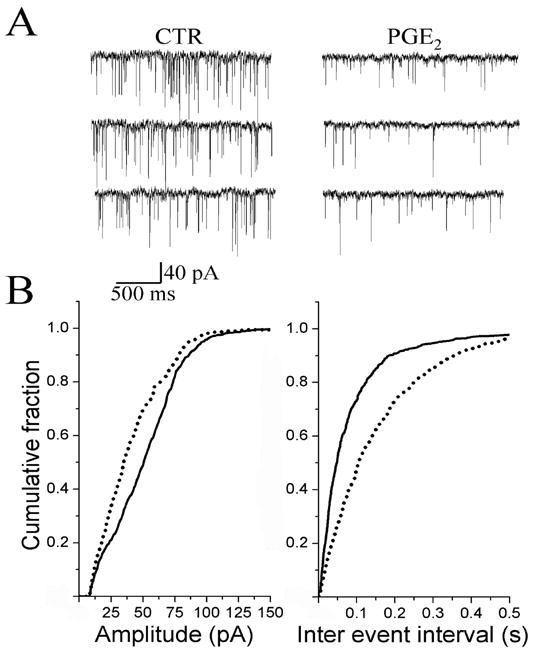
Figure 6.

Effect of PGE2 on the frequency and amplitude of spontaneous EPSCs (sEPSCs) recorded in NTS. A, recordings of sEPSCs before (CTR), and during superfusion of PGE2 (200 nM) for 5 min. B, cumulative probability of the amplitude (left panel) and inter-event interval distributions (right panel). Solid lines depict control; dashed lines are data recorded during PGE2 application. PGE2 increased the inter-event interval (p < 0.01) and decreased the amplitude (p < 0.01).
