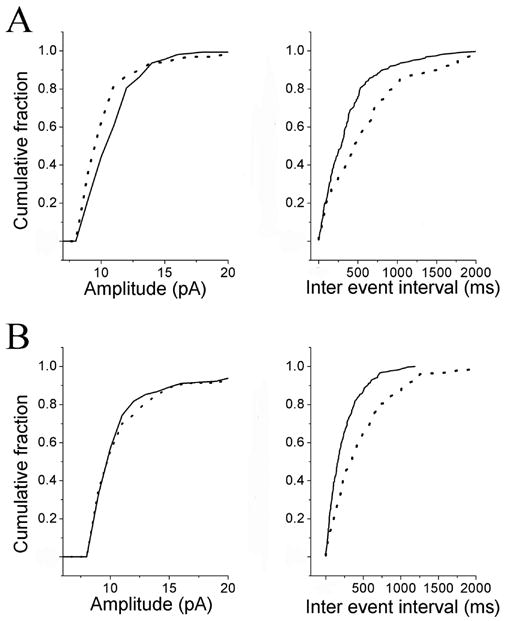
Figure 8.

Effects of PGE2 antagonists EP1 and EP2 on the PGE2-induced changes in the frequency and the amplitude of spontaneous EPSCs (sEPSCs). A, cumulative probability of the amplitude (left panel) and inter-event interval distributions (right panel). Solid line shows the effects of an EP1 receptor antagonist (SC19220 30 μM) while the data portrayed by the dotted line shows the effects of PGE2 (200 nM) plus SC19220 30 μM. In the presence of SC19220, PGE2 still increased the inter event interval (p < 0.01) and decreased the amplitude of spontaneous events (p < 0.01). B, cumulative probability of the amplitude (left panel) and inter-event interval distributions (right panel). Solid line shows the effects of EP1 (SC19220 30 μM) plus the EP2 (AH28848 20 μM) receptor antagonists. Dotted line shows the effects of PGE2 (200 nM) in the presence of a mixture of SC19220 30 μM plus AH28848 20 μM. In the presence of this mixture, PGE2 increased the inter event interval (p < 0.01) but did not affect the amplitude of spontaneous events (p > 0.05).
