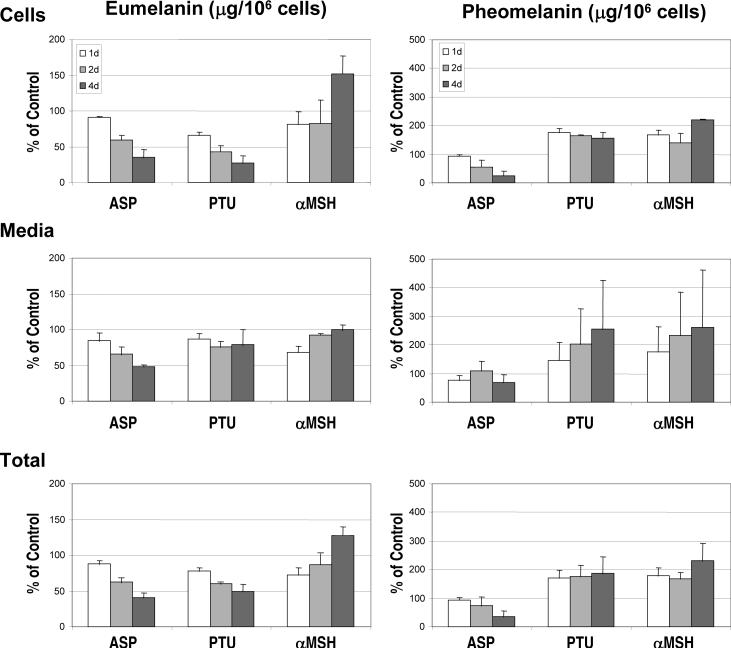
Figure 3.
Levels of eumelanin (left) and pheomelanin (right) in melanocytes and media after treatment with ASP, PTU or αMSH. Chemical measurements of PTCA (in duplicate) and 4-AHP as markers for eumelanin and pheomelanin, respectively, were performed on cells (top) harvested at D4 after the indicated time of treatment with or without ASP, PTU or αMSH, and on the medium (middle) from those 4 days of culture (collected at D2 and D4). Values are reported per 106 harvested cells (D4) and are expressed as a percentage of the control. Total melanin content (bottom) includes melanin in the cells and medium. Values represent the means ± SD of 3 independent assays.

