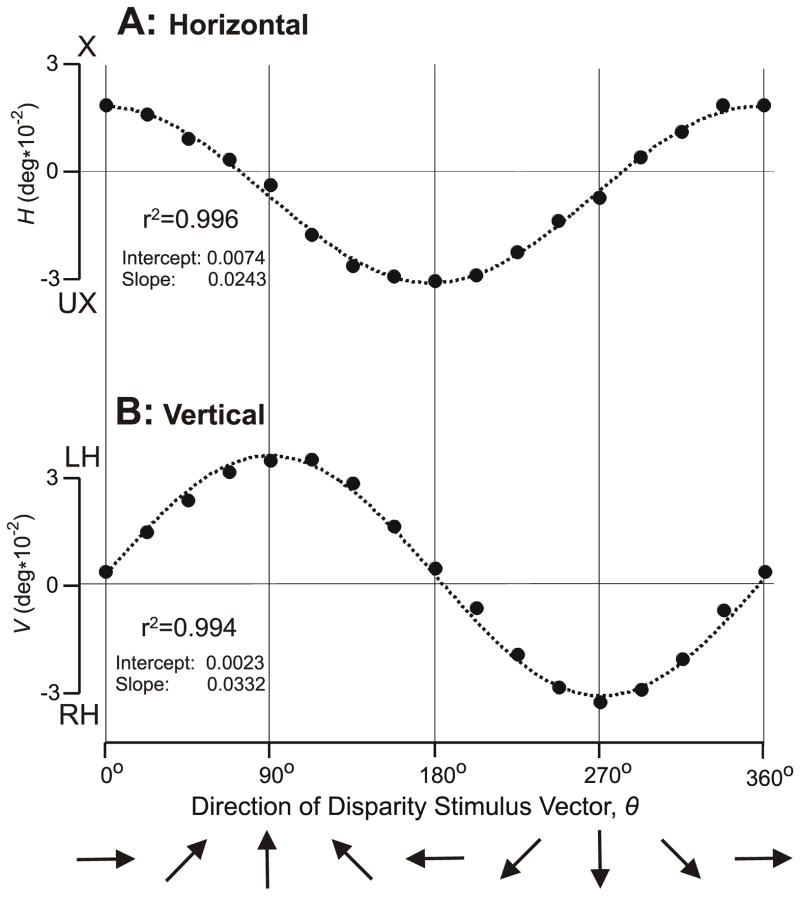
Figure 2.
The initial vergence responses when a 0.2° disparity was applied to random dot patterns: dependence of response measures on the direction of the disparity vector, θ (subject FAM). (A) Mean changes in horizontal vergence, H, in filled symbols; convergent responses are positive; X, crossed disparity; UX, uncrossed disparity. (B) Mean changes in vertical vergence, V, in filled symbols; left-sursumvergent responses are positive; LH, left-hyper disparity; RH, right-hyper disparity. Dotted curves are least squares best-fit plots of a+(b*cosθ) in (A) and a+(b*sinθ) in (B), where a and b are free parameters. Each datum point is the mean response to 110–120 repetitions of the stimulus. Standard errors of the means were smaller than the symbols (range: 0.0008–0.0011°).

