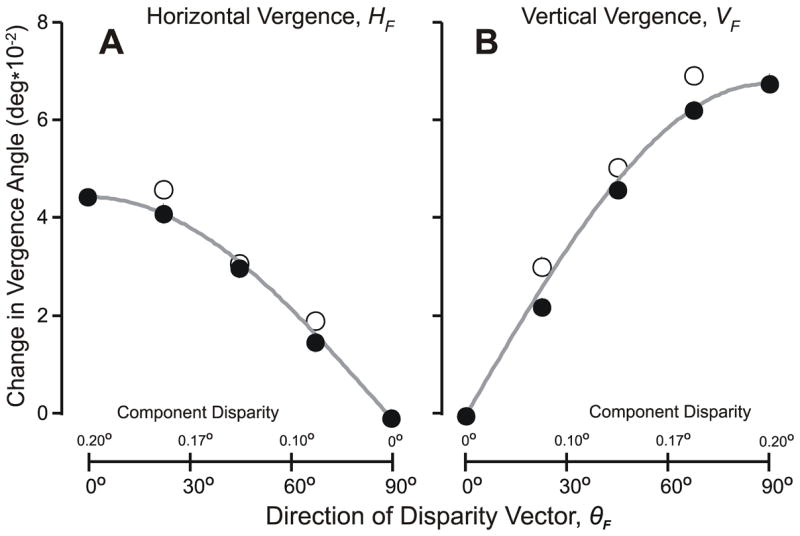
Figure 3.

The initial vergence responses when oblique disparities were applied to random-dot patterns: dependence of the folded response measures on the direction of the folded disparity vector, θF (subject FAM). (A) Mean changes in horizontal vergence, HF; data in filled symbols were obtained with oblique disparity vectors with a magnitude of 0.2°; data in open symbols were obtained with pure horizontal disparity vectors that matched the horizontal components of the oblique disparity vectors, and the magnitudes of their disparities, in degrees, are given on the abscissas above the axis (note: values increase to the left); grey curves are the values of HF given by HF0cosθF. (B) Mean changes in vertical vergence angle, VF; data in filled symbols were obtained with oblique disparity vectors with a magnitude of 0.2°; data in open symbols were obtained with pure vertical disparity vectors that matched the vertical components of the oblique disparity vectors, and the magnitudes of their disparities, in degrees, are given on the abscissas above the axis; grey curves are the values of VF given by VF90sin θF.
