
Figure 6.
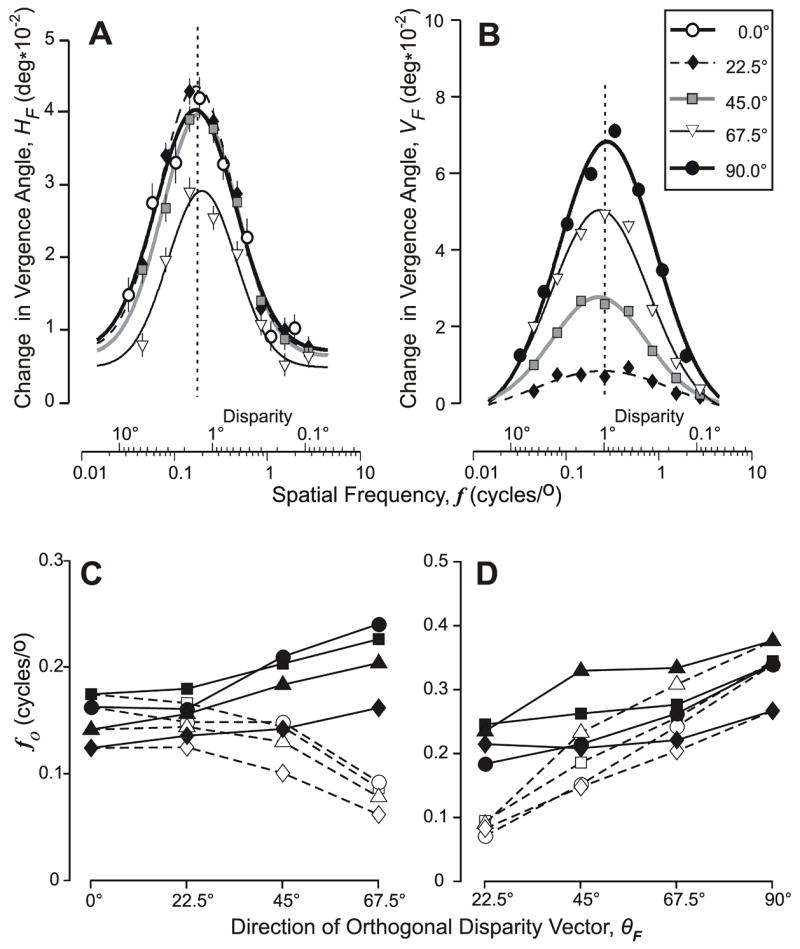
The initial vergence responses when 1-D sine-wave gratings had a binocular disparity of 1/4–wavelength: dependence of the folded response measures on the orthogonal spatial frequency of the grating (in cycles/°) when the orthogonal disparity vector (θF) had one of five (folded) directions. (A) Mean changes in horizontal vergence, HF, as θF was fixed at 0°(open circles), 22.5°(diamonds), 45°(squares), and 67.5°(triangles); curves show the least-squares best fit Gaussian functions whose parameters are listed in Table 3; vertical dashed line is aligned on the peak of the Gaussian for which θF=0°; subject FAM. (B) Mean changes in vertical vergence, VF, as θF was fixed at 22.5°(diamonds), 45°(squares), 67.5°(triangles), and 90°(closed circles); curves show the least-squares best fit Gaussian functions whose parameters are listed in Table 4; vertical dashed line is aligned on the peak of the Gaussian for which θF=90°; subject FAM. (C) Closed symbols show the spatial frequency at the peak of the best-fit Gaussian function (fo)—based on fits like those in (A)—as a function of the direction of the (folded) orthogonal disparity vector, θF, for all four subjects: FAM (squares), BMS (circles), HAR (triangles), and ST (diamonds); open symbols as for the closed symbols except that spatial frequency was specified with respect to the horizontal axis. (D) As in (C) except based on VF measures like those in (B), and open symbols show data when spatial frequency was specified with respect to the vertical axis.