
Figure 7.
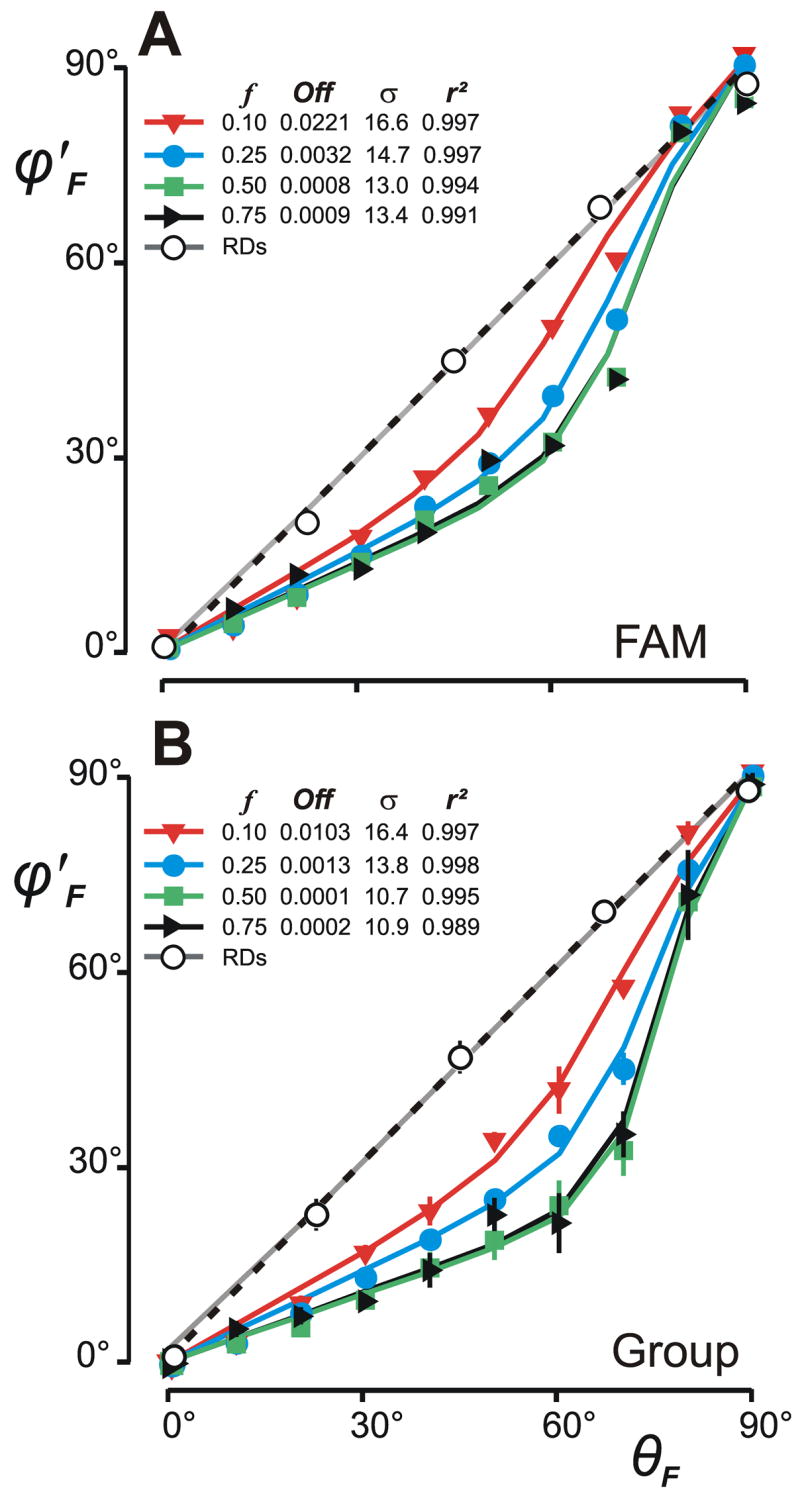
Directional Decoding “Errors”: dependence of the direction of the normalized folded vergence response vectors, φ′F, on the direction of the (folded) disparity vector, θF. (A) Data for subject, FAM. (B) Mean data (±SD) for four subjects. Closed symbols show data obtained with sine-wave gratings using the orthogonal disparity vector (see key for spatial frequencies). Open circles show data obtained with random-dot patterns. Curves are least-squares best fits obtained with the anisotropy model; the parameters of the Gaussian functions specifying the distributions of the preferred directions of the disparity sensors in the model are listed together with the Coefficients of Determination (r2): f, spatial frequency; Off, vertical offset; σ, standard deviation. Dashed lines are the unity-slope lines.