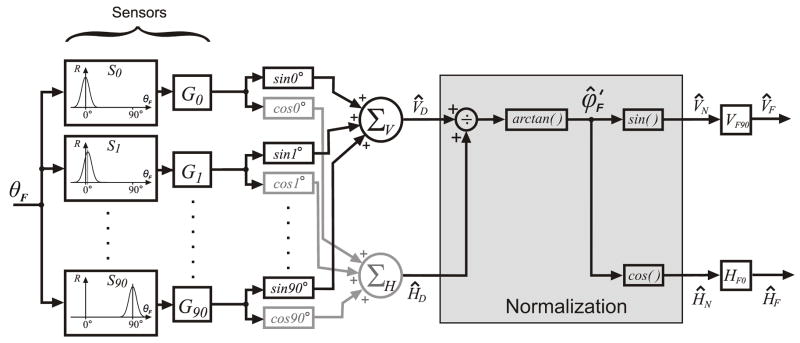
Figure 8.
A block diagram of the anisotropy model. The individual disparity sensors have a Gaussian dependence on the direction of the disparity vector (measured orthogonal to the orientation of the stimulus grating) and all sensors have the same peak response amplitude and bandwidth. The preferred directions of these sensors are arranged in order at 1° intervals (S0…S90). The gains of the sensor outputs (G0…G90) have a Gaussian distribution centered on the G0 element with a width and vertical offset that are free parameters. The outputs of the sensor gain elements, each weighted by the cosine (sine) of its preferred direction, are summed by the horizontal (vertical) vergence premotor controllers, ΣH (ΣV), to produce the horizontal (vertical) drive signals, ĤD(V̂D). A normalization stage then uses simple geometry, given by arctan (V̂D/ĤD), to derive a signal equivalent to the normalized folded response direction, , which is then decomposed into cosine and sine components, ĤN (V̂N), that are scaled by the two measured parameters, HF0 and VF90, to produce outputs encoding the horizontal and vertical vergence responses: and .

