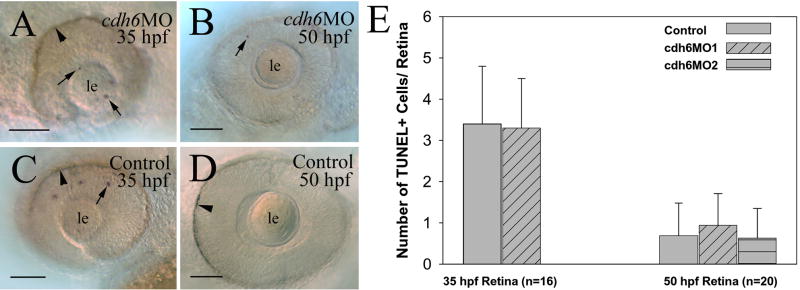
Figure 4.
Apoptosis analysis using TUNEL staining. Panels A-D are lateral views of whole mount eyes from embryos processed for TUNEL staining. Anterior is to the left and dorsal is up for these images. Arrows point to some TUNEL positive cells, while arrowheads indicate retinal pigmented epithelium. The number (n) in panel E represents the number of retinas examined for each group of embryos (e.g. control embryos vs. cdh6MO1 injected embryos). Abbreviations are the same as in Figure 1. Scale bars = 50 μm.

