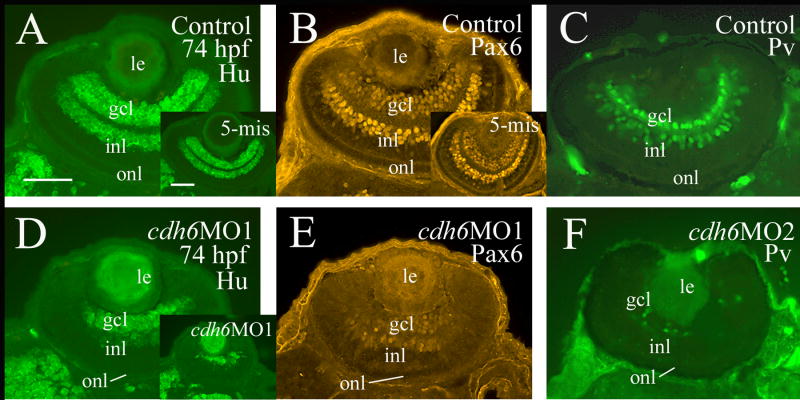
Figure 9.
Analysis of RGC and amacrine cell differentiation using anti-HuC/HuD (Hu, panles A, D and their inserts), Pax6 (panels B, E and panel B insert), and parvalbumin (Pv, Panels C and F) immunostaining. All images are from cross sections with dorsal to the left. Panels A, B, D and E are from PTU treated embryos, while panels C and F are from embryos raised in regular fish tank water. The insert in panel D is from a severely affected embryo. Abbreviations are the same as in Figure 1. Scale bars = 50 μm.

