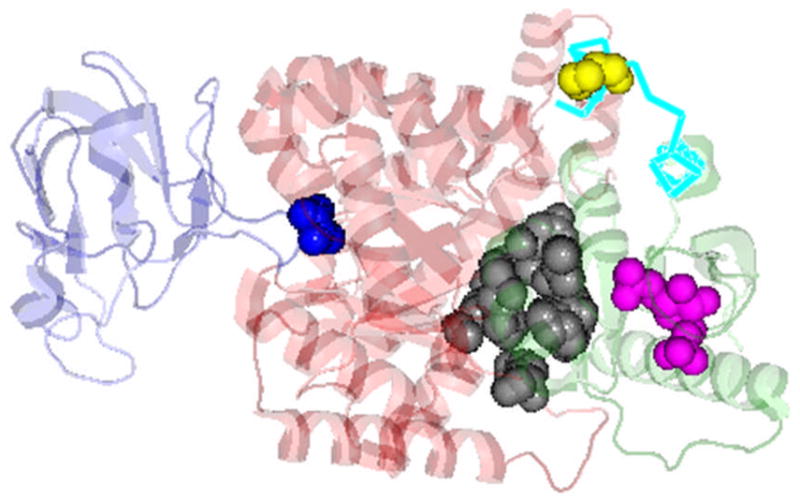
Fig. 2. Momoneric PK showing the A, B and C domains.

Color and domain identity are: B (blue), A (red), C (green). The ligand binding sites are: substrates (blue sphere); FBP (magenta sphere); pocket for Phe (inhibitor, black sphere) (based on PDB 2G50), location of the 22 amino acid differences between the PK isoforms in C-domain (cyan) and residue 402 (yellow sphere) (PyMol software presentation of PDB 1F3W).
