
Fig. 5. FT-IR amide spectra in D20.
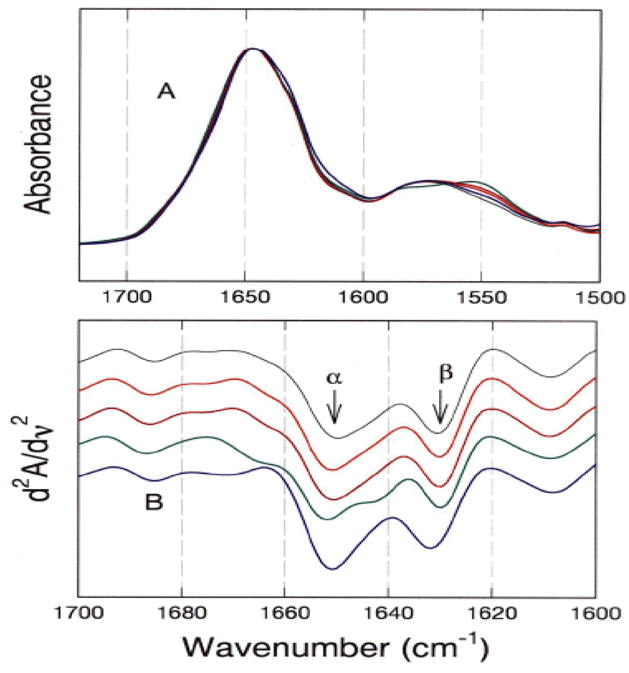
(A) Averaged absorption spectra of the amide I and II regions. (B) Second-derivative of amide I spectra. The bar represents the maximum deviations. The spectra are displaced in the Y-axis for clarity in presentation. The solution composition and color of the line are: (Black), Tris buffer; (Red), +7.2 mM Mg2+; (Dark red), +2 mM ADP; (Green), +2 mM PEP; and (Blue), +10 mM Phe [23].