
Figure 1.
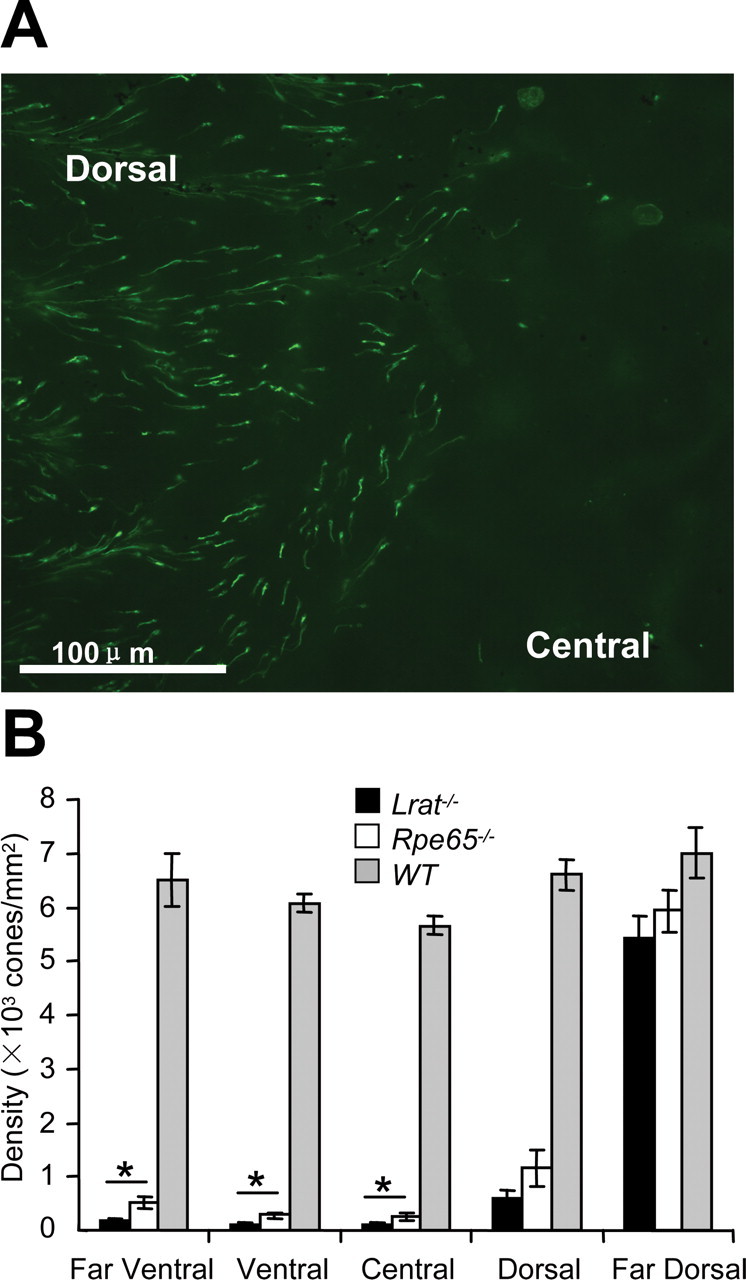
Cone distribution in Lrat−/− and Rpe65−/− retinas. A, Flat mount. Lrat−/− cones were visualized in mice at 4 weeks of age with FITC-conjugated peanut agglutinin (green) binding to the extracellular cone sheaths. Magnification, 20×. B, Bar graph depicting cone density. Cones were counted from five fields per flat-mounted retina, averaged in six mice from each group. Data are expressed as the mean number of cones/mm2 ± SEM. Overall cone cell counts did not differ between the two retinoid cycle mutants based on repeated-measures ANOVA followed by Dunnett's post hoc test (p < 0.05), whereas regional differences could be identified using one-way ANOVA followed by pairwise comparison using Tukey's post hoc test (*p < 0.05). White bars, Rpe65−/− mice; black bars, Lrat−/− mice; gray bars, WT mice.