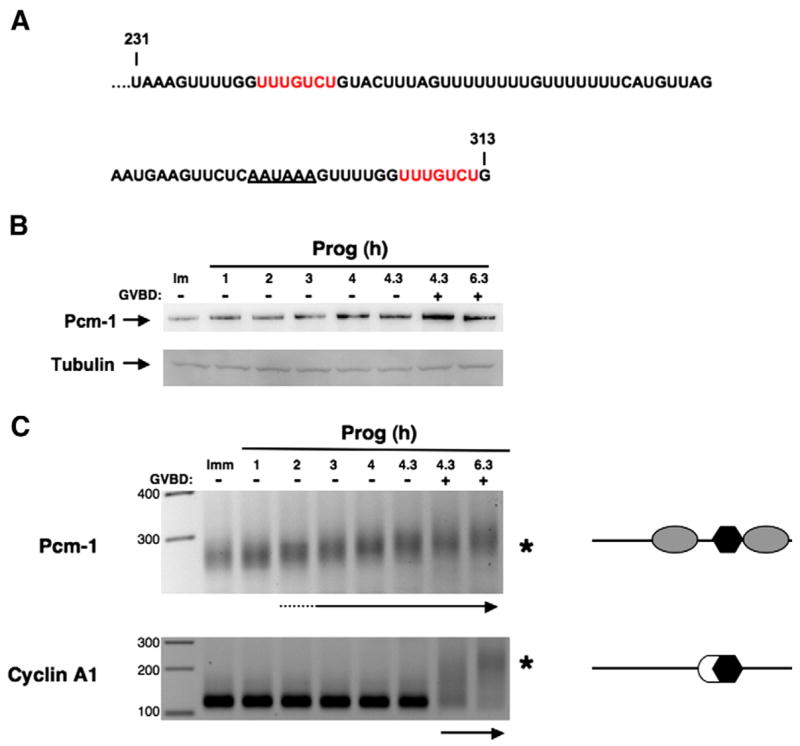
Fig. 6.

The Pcm-1 3′ UTR contains two TCS elements and displays early class mRNA polyadenylation in response to progesterone stimulation. (A) Sequence of the terminal 82 nucleotides of the Xenopus Pcm-1 3′ UTR. Two candidate TCS elements are indicated by red nucleotides and the polyadenylation hexanucleotide is underlined. (B) Immature oocytes (Imm) or oocytes treated with progesterone for the indicated times were analyzed for endogenous Pcm-1 protein levels (230 kDa) by western blot analysis. Equivalent protein was loaded for each time point as verified by a tubulin western blot of the same samples (lower panel). (C) Immature oocytes (Imm) or oocytes treated with progesterone were analyzed for endogenous Pcm-1 and cyclin A1 polyadenylation from the same samples used for the western blot analysis (B). An increase in PCR product size is indicative of polyadenylation (maximal polyadenylation is indicated by an asterisk for each mRNA). The arrows below each panel indicate when polyadenylation was first detected. The schematics to the right of each panel reflect the regulatory element composition of each 3′ UTR (open circles represent CPEs, gray ovals are the TCS elements, and polyadenylation hexanucleotides are shown as black hexagons). GVBD50 occurred after 4.3 h of stimulation.
