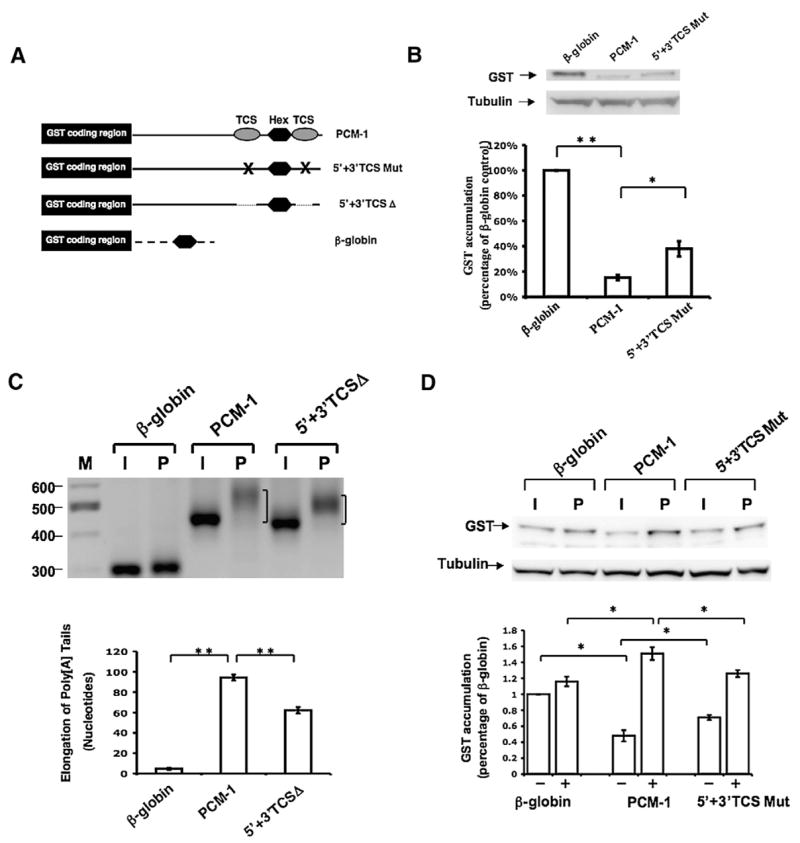
Fig. 7.

TCS-directed translational regulation contributes to both repression and translational activation exerted by the Pcm-1 3′ UTR. (A) Schematic representation of the Pcm-1 3′ UTR reporter mRNAs employed. Symbols are the same as used in Figs. 1, 5, and 6. (B) Immature oocytes were injected with the indicated reporter mRNAs and the levels of GST reporter mRNA translation assessed by western blot after 18 h of culture. The levels of GST accumulation were normalized for the levels of each reporter mRNA by real-time PCR (see Materials and methods) and quantitated over three independent experiments (graph). One-way analysis of variance and post hoc Newman–Keuls multiple comparison test were performed to analyze differences between the means. Means were scored as statistically significant, P<0.05 (*), P<0.001 (**). Error bars represent SEM. (C) Progesterone-dependent polyadenylation of wild-type or mutant TCS reporter mRNAs. Experiments were performed essentially as described in the legend to Fig. 3, using a forward primer specific to the GST coding region of the injected reporter mRNAs. The mode of the PCR product population was determined using AlphaEaseFC Software (Alpha Innotech) snap-to-peak analyses. Oocytes were cultured in the presence of progesterone for 4 h 20 min. Statistical differences between the mode length of poly[A] tail extension were assessed over three trials as described in panel B. (D) Immature oocytes were injected with the indicated reporter mRNAs and the levels of GST reporter mRNA translation in progesterone-stimulated oocytes and time-matched immature oocytes were assessed by GST western blot (upper panel) after 5 h of culture. The levels of GST accumulation were quantitated over four independent experiments (graph). Error bars represent SEM. One-way analysis of variance and post hoc Newman–Keuls multiple comparison test were performed. Differences between the means were scored as statistically significant, P<0.05 (*).
