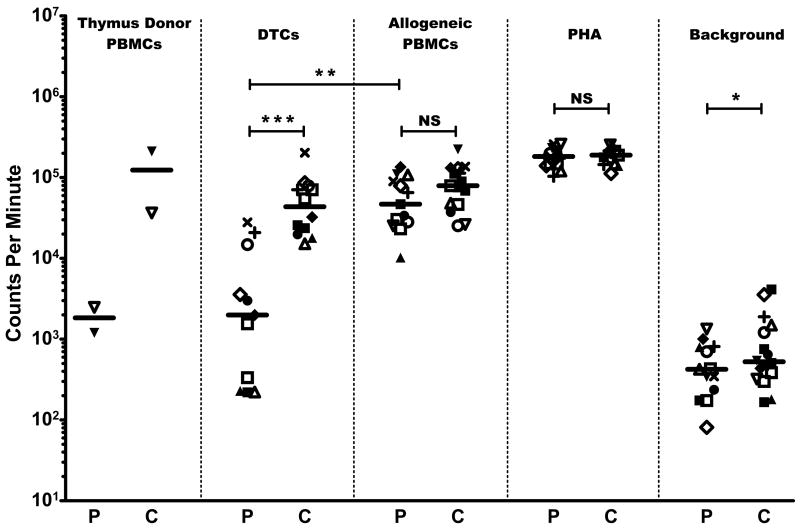
Figure 1. Proliferation studies.
Patient results (P) are shown compared to healthy adult controls (C). Symbols denote individual subject and corresponding control responses toward the stimuli listed at the top of each column for a given experiment; median values are shown by the horizontal bars (—). DIG105 (□) had the same sample of PBMCs tested twice. DIG120 (■) had multiple control samples tested in the same assay (see text). Responses are measured by 3H-thymidine incorporation shown in counts per minute. (*) = P < 0.05, (**) = P < 0.005, (***) = P < 0.00001, NS = P ≥ 0.05.

