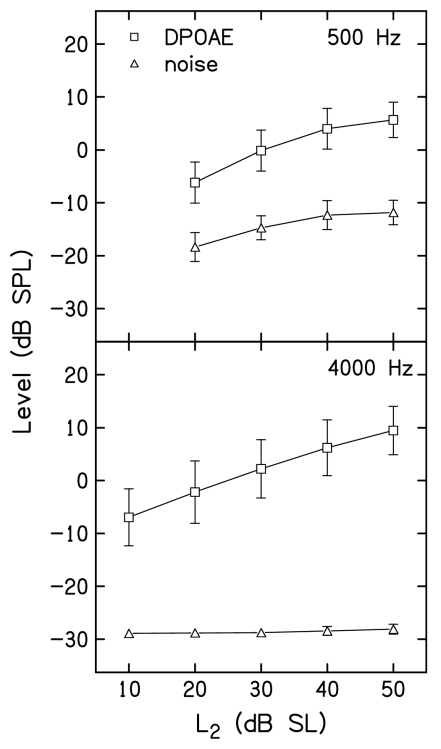
Figure 2.
DPOAE and noise levels for the control conditions, in which there was no suppressor. Top: Mean DPOAE (squares) and noise (triangles) levels in dB SPL as a function of L2 in dB SL when f2=500 Hz. Bottom: Mean DPOAE (squares) and noise (triangles) levels in dB SPL as a function of L2 in dB SL when f2=4000 Hz. In both panels, error bars represent ±1 s.d.

