
Fig. 2. Fluorometric analysis of formation of HNO from peroxidation of NH2OH by HRP.
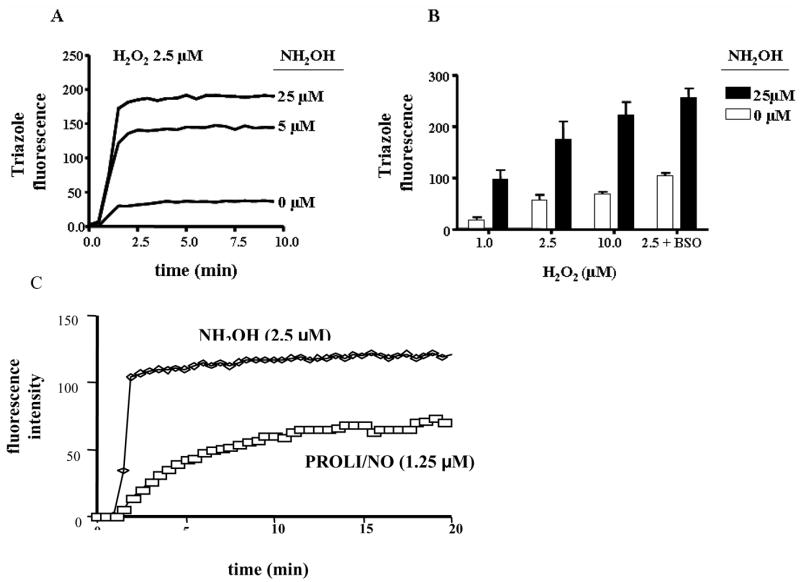
DAF (5 μM) was incorporated into MCF-7 cells during a 15 min incubation period at 37°C. Following centrifugation and wash steps to remove unincorporated DAF, signal intensity was monitored in a suspension of 106 cells/mL in 10 mM phosphate buffer (pH 7.4) containing DTPA (50 μM), HRP (5 μM) and H2O2 (2.5 μM) at 37°C. Intracellular triazole fluorescence was detected at 515 nm following 488 nm excitation. A) Dose response to NH2OH; B) intensity after 5 min following addition of H2O2 as indicated in the absence or presence of NH2OH. The last panel shows the effect of depletion of GSH by overnight incubation with BSO (5 mM). Data are representative A) or the mean B) of at least four individual experiments. C) Comparison of intracellular fluorescence intensity during peroxidation of NH2OH or decomposition of PROLI/NO (1.25 μM) in phosphate buffer alone.