
Figure 3.
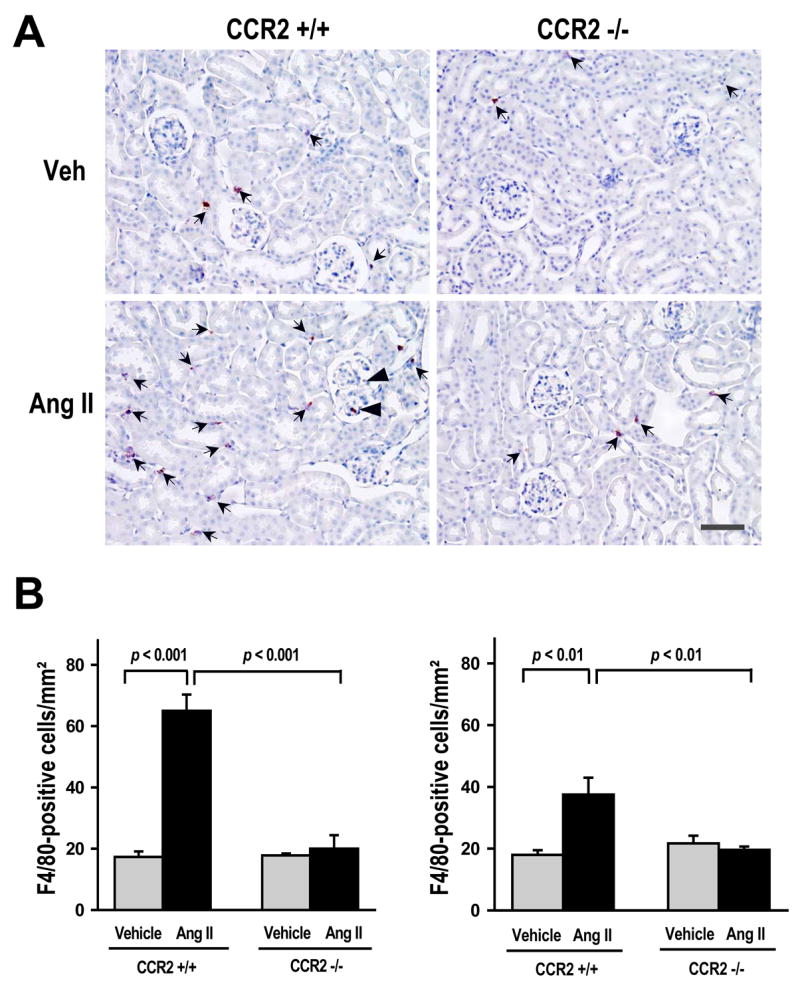
(A) Representative immunohistochemical staining for F4/80-positive cells (macrophages) in mice infused for 2 weeks with either vehicle or Ang II. Reddish-brown color in the cytoplasm indicates positive staining. Positive staining for macrophages was found mainly in the tubulointerstitial space (arrows) and to a lesser extent in the glomerulus (arrow-heads). Scale Bar = 50 μm.
(B) Quantitative analysis of immunohistochemical staining for F4/80-positive cells (macrophages) at 2 (left) and 4 weeks (right). In CCR2+/+ with Ang II-induced hypertension the number of positive cells increased significantly at both 2 and 4 weeks (p < 0.01, vehicle vs Ang II). However, macrophage infiltration was higher at 2 weeks. In CCR2−/− with Ang II induced hypertension, macrophage infiltration did not increase at either 2 or 4 weeks. (2 weeks, n=5 per group; and 4 weeks, n=8 per group).