
Figure 3.
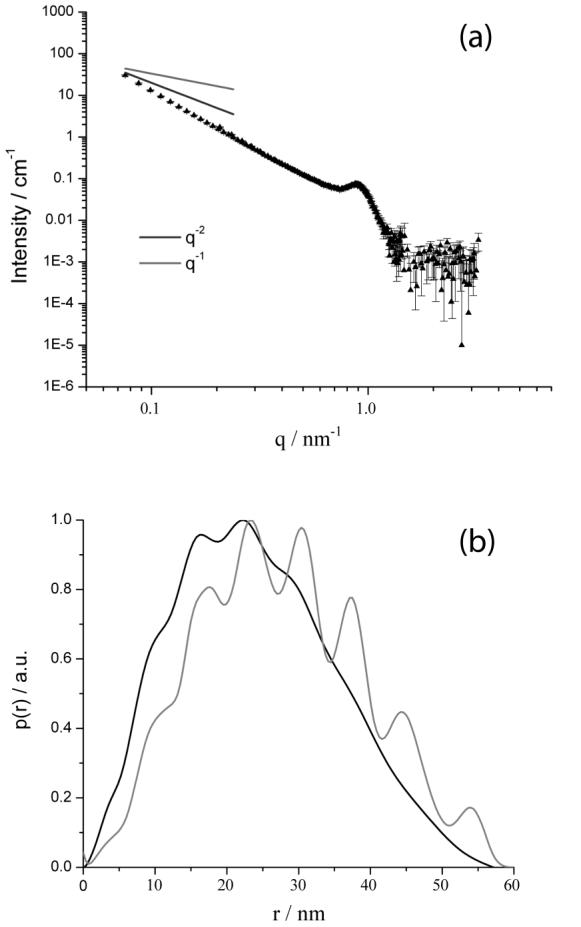
(a) SANS spectrum measured using complexes formed by DODAB:DOPE (1:1) and salmon sperm DNA at a charge ratio of 2:1. (b) PDDF calculated from the indirect Fourier transform of the data in (a) (dark line). For comparison, the gray line shows the PDDF calculated for a multilamellar vesicle model with a core radius of 5.0nm and on average 6 shells, where each shell has a thickness 4.5nm and is separated by a water layer of thickness 2.5nm.