Figure 6.

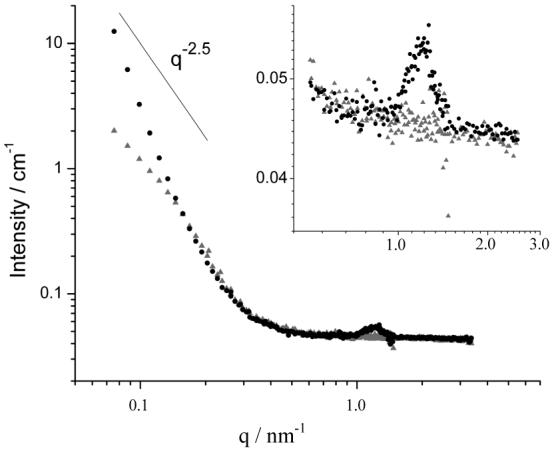
SANS spectra obtained using solutions of reduced (dark symbols, charge ratio 1.1:1) and oxidized (light symbols, charge ratio 3.3:1) BFDMA (1mM) in the presence of DNA (2.9mg/ml). A line with a slope of -2.5 is included for comparison.

SANS spectra obtained using solutions of reduced (dark symbols, charge ratio 1.1:1) and oxidized (light symbols, charge ratio 3.3:1) BFDMA (1mM) in the presence of DNA (2.9mg/ml). A line with a slope of -2.5 is included for comparison.