
Figure 8.
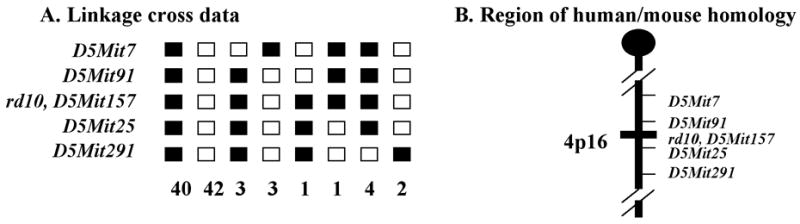
A. 96 mice from a backcross between rd10/rd10 and CAST/Ei were phenotyped and genotyped. Linkage to several markers on mouse Chr 5 was observed. The columns of squares represent haplotypes (filled boxes, rd10/rd10 allele; open boxes, CAST/Ei allele). The number of chromosomes with each haplotype is indicated below each column. B. Genetic map of Chr 5 in the rd10 region showing the closest markers and the region of human homology. Recombination estimates (± standard error) and order for the closest markers were D5Mit91 − 1.04±1.04 − rd10, D5Mit157 − 1.04±1.04 −D5Mit25.