
Figure 5.
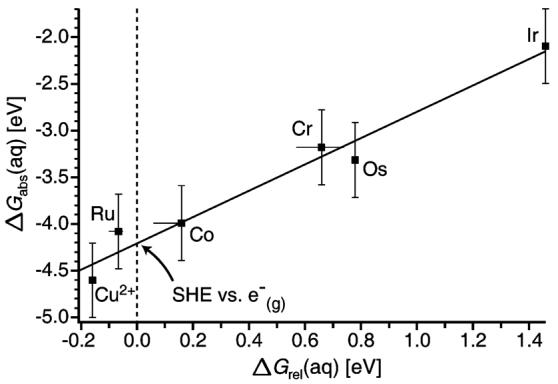
Absolute solution-phase ΔG values for the [M(NH3)6]3+/2+, M = Ru, Co, Os, Cr, and Ir, and Cu2+/1+, couples obtained from gas-phase nanodrop measurements versus the corresponding relative solution-phase values. The solid line is a linear regression fit with a slope of 1.4 and y-intercept of −4.2 eV or +4.2 V. The y-axis (dashed line) intercept corresponds to the absolute SHE versus a free electron. Error bars reflect a select range of reported solution-phase values and estimates of the uncertainty in the gas-phase measurements.