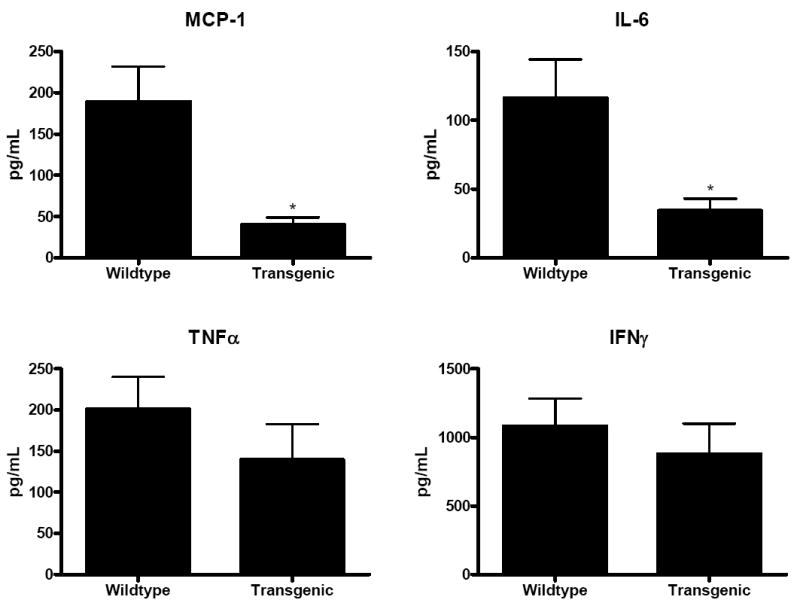
Fig. 8. Cytokine levels in splenocytes stimulated with anti-CD3/CD28 24 h after CLP.

Levels of MCP-1 and IL-6 released from stimulated splenocytes were lower in Fabpi-IL-10 mice than in WT animals. Asterisks represents p values <0.05. In contrast, levels of TNFα and IFNγ levels produced by stimulated splenocytes was similar between transgenic and WT animals (n=8-10 animals/group).
