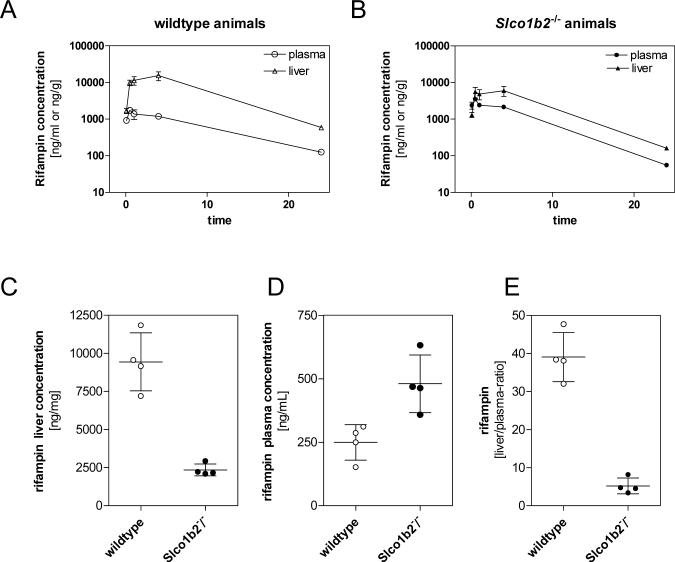
Figure 4.
Rifampin concentration in plasma (○) and liver (Δ) of wildtype (A) and Slco1b2−/− (B) mice (n=5−6/time point) after a single intravenous dose of rifampin (1mg/kg). Steady-state rifampin concentration in liver (C) and plasma (D) in animals treated with continuous subcutaneous infusion of rifampin at a rate of 8 μg/hr over 24 hrs using Alzet Mini-osmotic pumps (n=4). Panel E shows the calculated liver to plasma ratio comparing wildtype and Slco1b2−/− animals. Data are expressed as mean ± SD.

