
Figure 5.
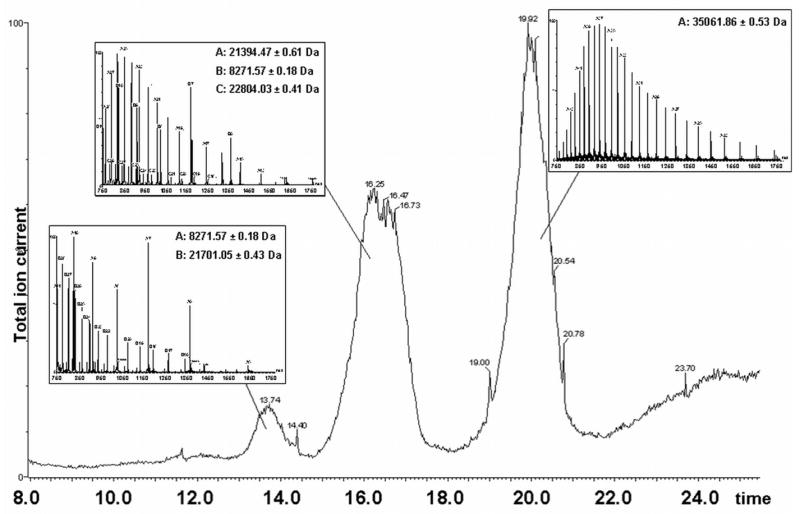
Reverse phase chromatography and ESI-MS of SaPI1 procapsids. The total ion current of the MS detector is plotted against elution time in minutes. The ion current does not accurately reflect the abundance of the measured ionic species. Peaks and their corresponding spectra are shown with the measured masses listed. Peak one (approximately 14 min) includes SaPI1 gp6 (theoretical mass 8,271.5 Da) and N-terminally truncated scaffolding protein gp46 (21,700.9 Da); peak two also contains gp6 as well as SaPI1 gp7 (22,805.3 Da) and major tail protein gp53 (21,394.5 Da). The third peak in the chromatogram contains N-terminally truncated major capsid protein gp47 (35,062.9 Da).