Fig. 5.

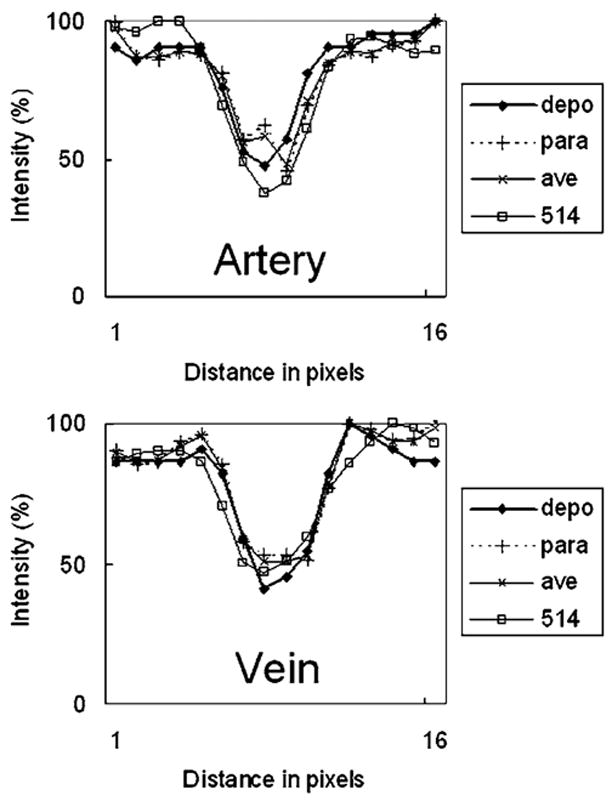
Computed data for blood vessel profiles of a retinal artery and a retinal vein, in Fig. 3. Each profile was plotted as a percentage of maximum grayscale unit in each profile, as a function of location in profile.

Computed data for blood vessel profiles of a retinal artery and a retinal vein, in Fig. 3. Each profile was plotted as a percentage of maximum grayscale unit in each profile, as a function of location in profile.