
Fig. 7.
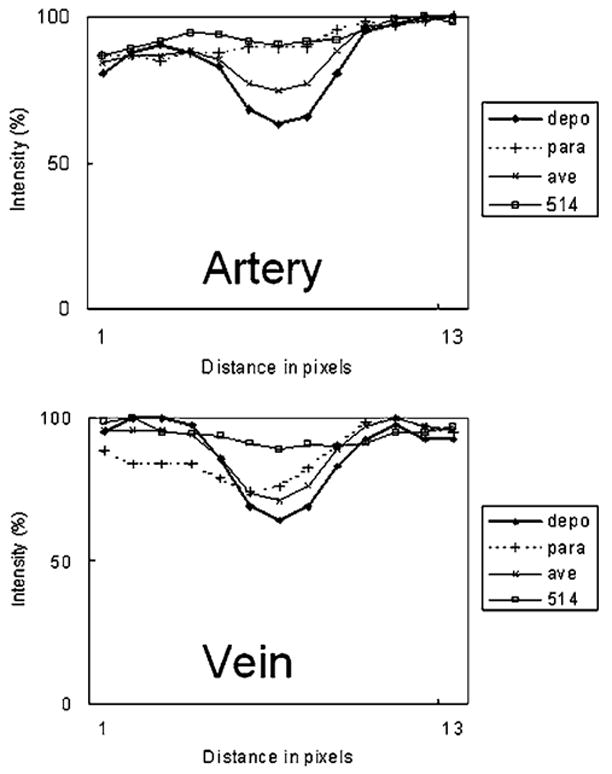
Computed data for blood vessel profiles of a retinal artery and a retinal vein, in Fig. 5. Each profile was plotted as a percentage of maximum grayscale unit in each profile, as a function of location in profile.
Official websites use .gov
A
.gov website belongs to an official
government organization in the United States.
Secure .gov websites use HTTPS
A lock (
) or https:// means you've safely
connected to the .gov website. Share sensitive
information only on official, secure websites.
Computed data for blood vessel profiles of a retinal artery and a retinal vein, in Fig. 5. Each profile was plotted as a percentage of maximum grayscale unit in each profile, as a function of location in profile.