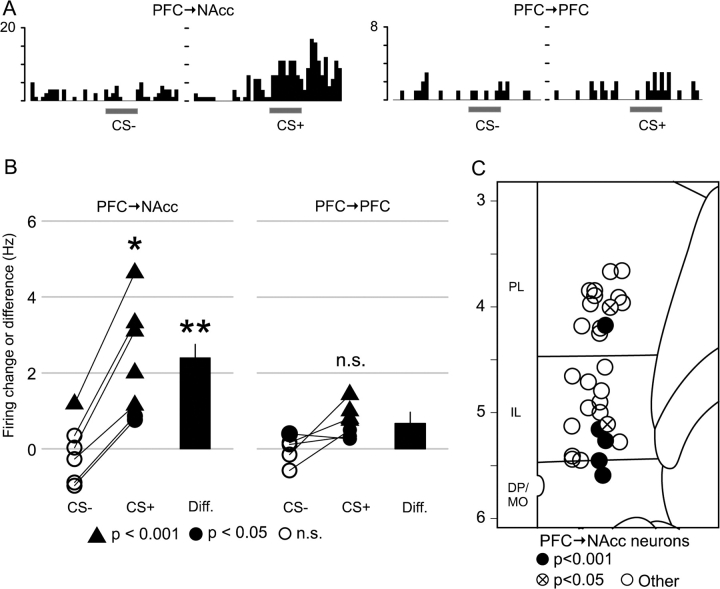
Figure 6.
(A) Peristimulus time histograms from a single PFC → NAcc neuron (left) and a single PFC → PFC neuron (right) during presentation of conditioned odors (1-s bins). The gray bar indicates the time when the odor was presented (10 s). y-axis is number of spikes per bin. (B) Odor-evoked changes in firing rate in response to the CS+ and CS− odors for single neurons (triangles and circles); and mean differences between CS+ and CS− responses (bars). In PFC → NAcc neurons with significant excitatory responses to the CS+ (left), CS+ responses were greater than CS− responses (n = 6, P < 0.03 paired Wilcoxon rank sum test); but this was not the case for PFC → PFC neurons with significant CS+ excitation (right, n = 5, P < 0.13). The mean difference between CS+ and CS− responses was greater in PFC → NAcc neurons (n = 6, left bar) than in PFC → PFC neurons (n = 5, right bar; P < 0.009, Wilcoxon rank sum test). The plotting symbols indicate the response to odor presentation: triangles for excitation exceeding a P < 0.001 threshold (highly excited); filled circles for excitation exceeding a P < 0.05 threshold; empty circles for no significant excitation. (C) The locations of all PFC → NAcc neurons recorded during odor testing. Most excited PFC → NAcc neurons (5/7) were located in IL or DP/MO cortex. y-axis is atlas coordinates in millimeters.

