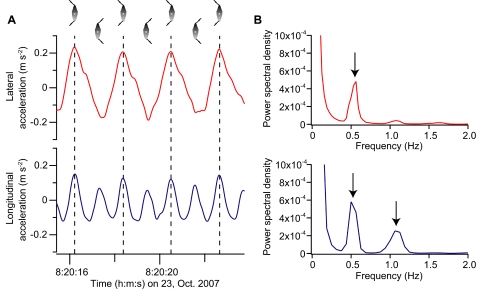
Figure 2. Lateral (red line) and longitudinal (blue line) accelerations recorded from an ocean sunfish (mass, 48 kg).
(A) Typical examples. The vertical broken lines delineate the separation of the stroke cycle. (B) Power spectral density (PSD) calculated from the entire data set of this individual. Arrows indicate peaks.

