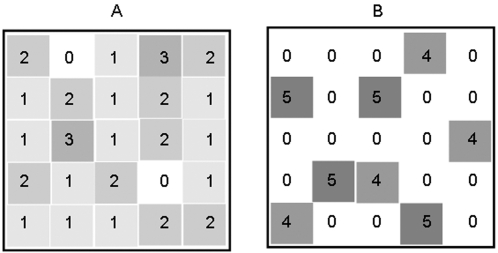
Figure 1. Predicted distribution of total investment.
The same total investment (sum of cell values) into a resource landscape with (A) uniformly low risk where investment is evenly spread among options or (B) uniformly high risk with distinct investment peaks (B). Higher number and darker colour indicate a higher local investment.

