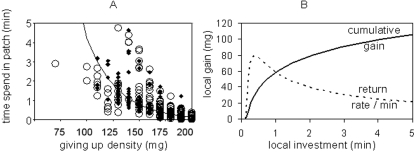
Figure 2. Local gain and investment (patch residency).
(A) Observational data on patch residency from a video analysis of foraging bank voles (11 animals, 22 trials, 369 experimental patches with initial food density of 200 mg, open circles: safe risk-uniform conditions, diamonds: risky uniform conditions) and predictions (line) of patch residency by the measured amount of food left over in the patch (giving up density) with an exponential model: time = −272 sec*e(−7327,6*gud(mg)) with R2 = 0.571, F = 491; p<0,001. (B) Predictions for cumulative gain (solid line) and diminishing returns (rate per minute, dashed line) over patch residency based on A.

