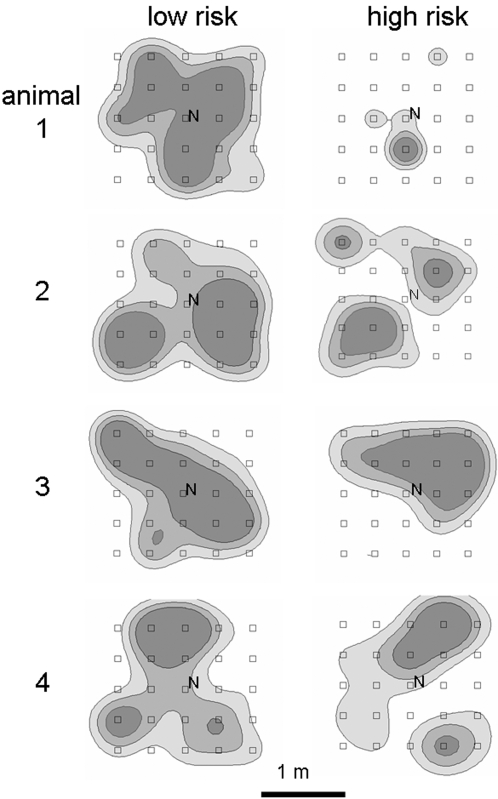
Figure 3. Spatial distribution of time investment.
Four exemplary foragers (male bank voles) at their first day of foraging under safe (left) and risky (right) conditions. Investment is displayed as Kernel contour cores 50% (darkest), 75% (lighter) and 95% (lightest shade) based on location density (time investment) and distance between locations.

