Figure 7.

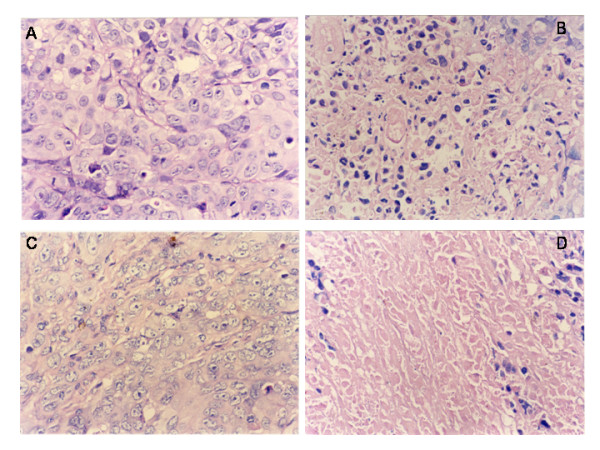
Histopathological analysis of tumor tissues after pVLTR-tk/GCV treatment. A: CNE1+TK (400×); B: CNE1+TK+GCV (400×); C: CNE1-LMP1+TK (400×); D: CNE1-LMP1+TK+GCV (400×).

Histopathological analysis of tumor tissues after pVLTR-tk/GCV treatment. A: CNE1+TK (400×); B: CNE1+TK+GCV (400×); C: CNE1-LMP1+TK (400×); D: CNE1-LMP1+TK+GCV (400×).