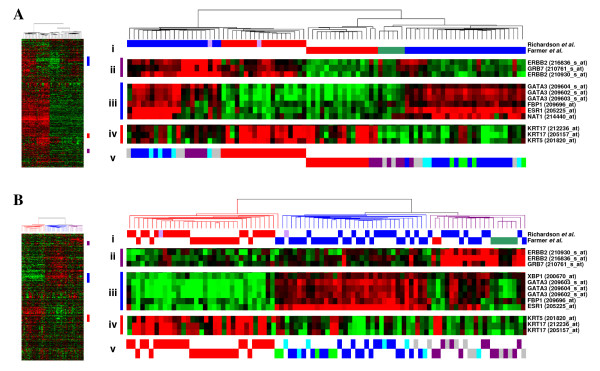
Figure 2.
Comparison of breast tumour gene expression profiles generated by two published studies. The Farmer et al. study used U133A GeneChips with RNA amplification, whereas the Richardson et al. study used U133 plus 2.0 arrays and the standard labeling protocol. A, Before mean batch-centering. B, After mean batch-centering. Hierarchical clustering of tumours based upon 640 probesets representing Sorlie et al. [8] 'intrinsic' genes. Thumbnails show all 640 probesets. i) Tumours classified by Richardson et al. [10] red = basal-like, blue = non-basal like, pink = BRCA1; tumours classified by Farmer et al. [11] red = basal, blue = luminal, green = apocrine. Clusters of genes associated with the 'Sorlie subtypes' are highlighted as follows; ii) ERBB2 gene cluster, iii) luminal A gene cluster, iv) basal gene cluster. v) Centroid prediction was used to assign the tumours to the five Norway/Stanford subtypes – basal (red), luminal A (dark blue), luminal B (light blue), ERBB2 (purple) and normal-like (green), unassigned (grey).

