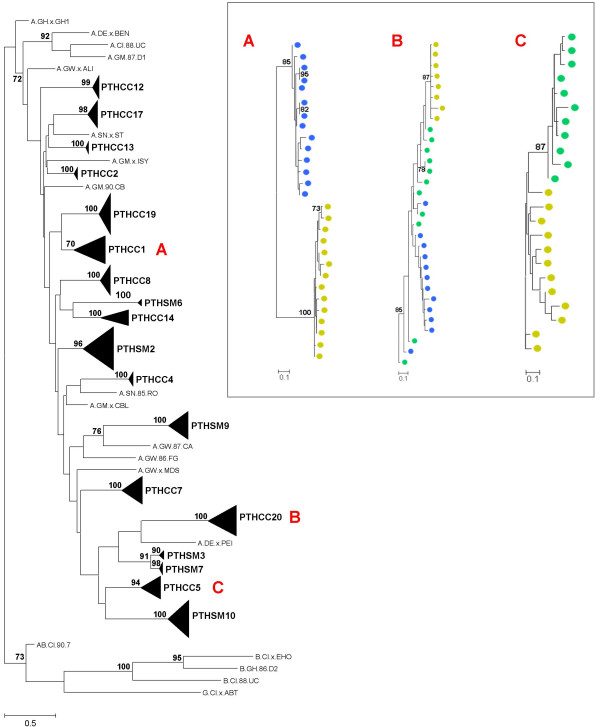
Figure 1.
Maximum-likelihood phylogenetic analysis. The phylogenetic tree was constructed with reference sequences from HIV-2 groups A, B and G, under the TVM+G+I evolutionary model, using the NNI heuristic search strategy and 1000 bootstrap replications. The triangles represent the compressed subtrees containing clonal sequences obtained from all samples collected for each patient. The length of the triangle represents the intra-patient nucleotide diversity and its thickness is proportional to the number of sequences. The bootstrap values supporting the internal branches are shown. The scale bar represents evolutionary distances in substitutions per site. The inset contains the subtrees of patient PTHCC1 (A), PTHCC20 (B) and PTHCC5 (C) (Yellow circle – 2003; green circle – 2004; blue circle – 2005).

