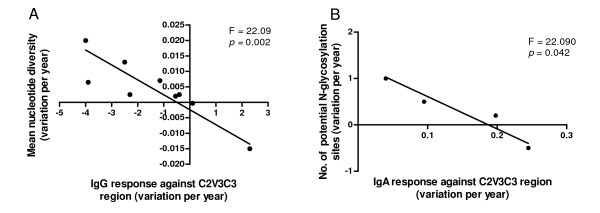
Figure 4.
C2V3C3 sequence evolution along the course of infection as a function of antibody response. Deming regression analysis. (A) Annual variation (slope) of the C2V3C3-IgG response vs Annual variation (slope) of the mean nucleotide diversity; (B) Annual variation (slope) of the C2V3C3-IgA response vs Annual variation (slope) of the number of potential N-glycosylation sites.

