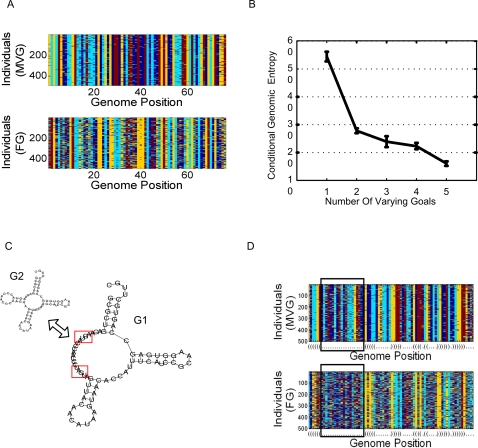
Figure 7. Reduction in genetic variance in MVG evolution.
(A) Genomes of evolved RNA populations under FG and MVG scenarios. Each row corresponds to a 76-nucleotide genome of an individual in the population. Color stands for the genomic position content (A,U,G,C). For MVG, the end of the last G1-epoch population is presented. (B) Conditional genomic entropy (mean±SE) as a function of number of goals presented along MVG evolution (x-axis). (C) FG scenario was toward G1. In MVG the goal switched repeatedly between G1 and G2. G2 is a modular variation of G1 with hairpin instead of an open loop in a module corresponding to genomic positions 7 to 26. (D) Genomes of evolved RNA populations with FG and MVG scenarios as described in (C). Note the low variance in MVG populations within the marked region, which corresponds to the genomic positions of the loop region that varies between goals.

