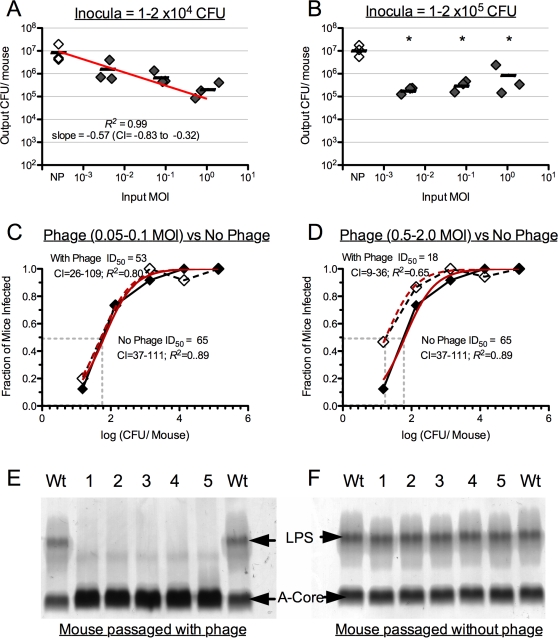
Figure 5. Coinfection of infant mice with V. cholerae and lytic vibriophage.
A. Average colonization (bar) of mice inoculated with in vitro derived strains (EN159 EN182, EN191) co-infected with the paired phage isolate (solid diamonds). The bacterial dose is constant (1–2×10⁴ CFU/mouse) and the phage dose is variable ranging from a MOI of 10−3 to 1.0. NP = no phage control (clear diamonds). Each diamond represents the median of 5 technical replicates (mice) for a given biological replicate (EN159, EN182, EN191). CI = 95% confidence interval for the slope of the linear line. B. Same as ‘A’ except a constant bacterial dose of 1–2×10⁵ CFU/mouse. *Significant difference compared to the no phage control (Student's t-Test; P<0.05). C. ID50 plotted by the log(CFU/Mouse) against the fraction of mice infected. Inoculation with a constant phage dose (MOI = 0.05–0.1; solid diamond/line) and a variable dose of in vitro derived V. cholerae. No phage control = clear diamonds/dashed line; CI = 95% confidence interval for the ID50 calculated from the fitted curve (red) modeled with the Hill Equation. Each symbol represents the average of 3 biological replicates (≥5 mice per biological replicate). D. Same as ‘C’ except with a constant phage dose of MOI = 0.5–2.0. E. Analysis of LPS isolated from wild-type EN159 (Wt), or mouse passaged EN159 (1–5) isolated from mice infected at 1.5×10⁵ CFU/mouse as in ‘B’ and an MOI of 2.0. Upper arrow indicates fully synthesized LPS with attached O antigen, lower arrow indicates the lipid A-core oligosaccharide precursor. F. Same as ‘E’ except mouse passaged isolates (1–5) were in the absence of phage (NP).

