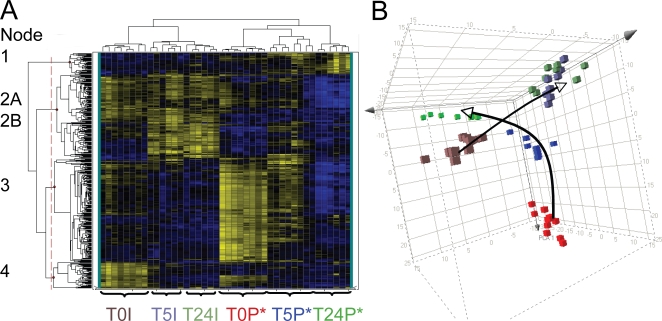
Figure 6. Transcriptional profiles of patient derived and in vitro derived V. cholerae incubated in a pond microcosm.
A. Heat map of 435 genes that are differentially regulated (ANOVA P<1×10⁻⁷; N = 2) in at least one of the following six conditions: V. cholerae from patients (T0P*, T5P*, T24P*) or in vitro culture (T0I, T5I, or T24I) incubated for 0, 5, or 24 h; the patient samples harbored phage*. Yellow and blue represent induced (max = 46-fold) and repressed (max = 20-fold) genes, respectively. The sample labels at the bottom are color-coded to match the right panel. The thin vertical dotted line breaks the genes into four major groups (nodes) provided in the supplement from top to bottom as Nodes 1-4 (Tables S3, S4, S5, S6 and S7). Node two is subdivided into 2A (upper; Table S4) and 2B (lower; Table S5). B. Principal Component Analysis (PCA) of the 435 gene expression values in ‘A’. The arrows indicate the ‘transcriptional movement’ from 0 to 5 to 24 h for the patient and in vitro derived V. cholerae.

