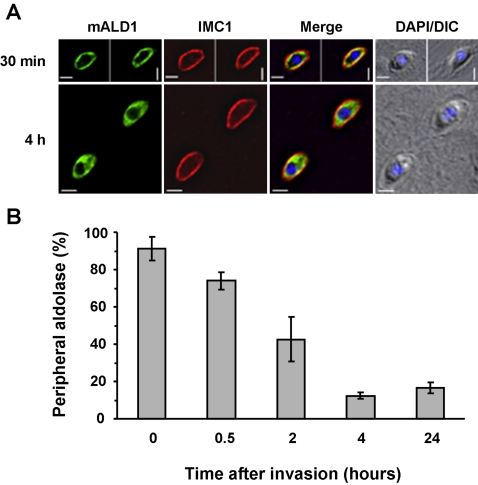
Figure 6. Quantitative analysis of aldolase-1 distribution in Toxoplasma.
Freshly egressed parasites expressing myc-aldolase 1 were allowed to attach to HFF monolayers for 5 minutes at 37°C in complete medium. Non-attached parasites were washed off and the incubation continued in complete medium at 37°C for the indicated times. (A) The distribution of aldolase-1 30 minutes and 4 hours after invasion of host cells. Overlays are shown of myc-aldolase-1 (mALD1, green), the IMC protein IMC1 (red). Overlay pictures of DIC and DAPI blue) are shown on the right. Parasite-infected cells were fixed in −20°C methanol. Images of the individual channels are shown in Figure S4. Bars = 2 µm. (B) A quantitative analysis of the results is shown. Data represent averages of 32 fields counted over 4 samples. Error bars indicate the standard deviation.

