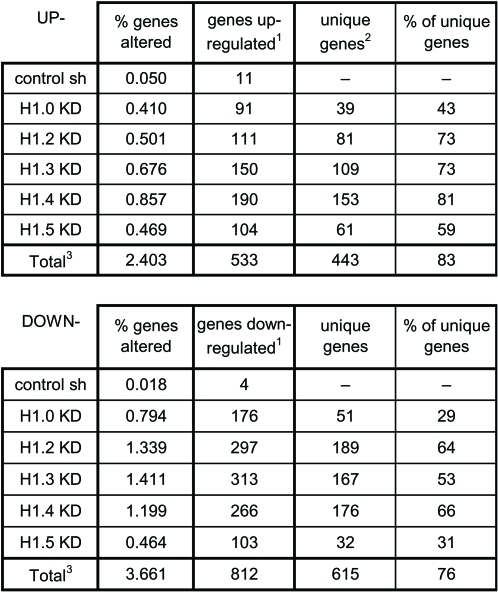
Figure 7. Summary of analysis of gene expression in H1 variant KD cells with genome-wide microarrays.
1 Number of genes with increased or decreased expression ≥1.4 fold (q≤0.1) in the presence of Dox versus in the absence of Dox (6 days). 2 Number of genes altered by depletion of a particular isoform only. 3 Total refers to the genes altered by depletion of some of the H1 isoforms. Genes affected by more than one isoform are counted only once.

