
FIGURE 1.
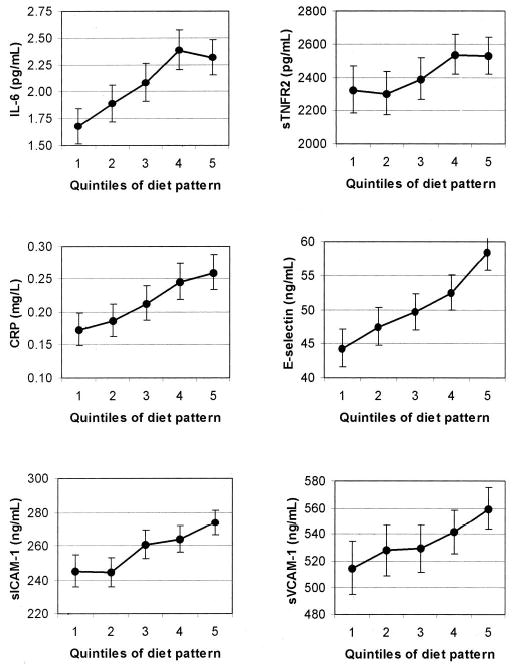
Geometric mean concentrations and 95% CIs of interleukin 6 (IL-6), soluble tumor necrosis factor α receptor 2 (sTNFR2), C-reactive protein (CRP), E-selectin, soluble intracellular cell adhesion molecule 1 (sICAM-1), and soluble vascular cell adhesion molecule 1 (sVCAM-1) by quintiles of diet pattern score adjusted for age, BMI (9 categories), physical activity (quintiles), family history of diabetes, smoking (never, past, current, or missing), postmenopausal hormone use (never, ever, or missing), energy intake (quintiles), and fasting status. The comparison between quintile 5 and quintile 1 was significant for all biomarkers, P < 0.05. Quintile cutoffs were based on distributions in controls.