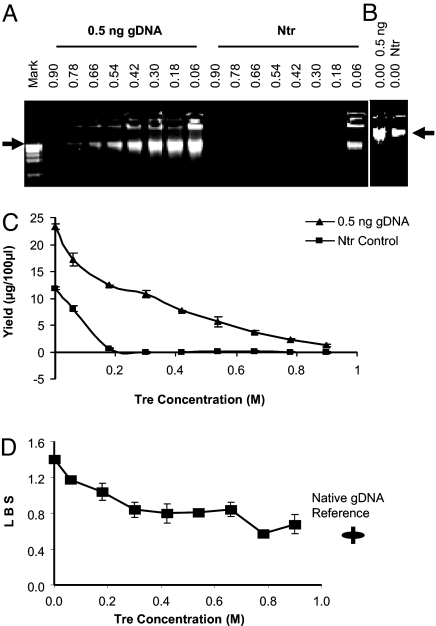
Fig. 1.
At appropriate Tre concentrations, TIPs were eliminated, and the locus representation of the amplicon was improved. Extracted gDNA (0.5 ng) vs. Ntr control was tested. Tre preparation lot T808 was used. The numbers above refer the final concentration of Tre. Arrow: 12 kb. (A) Tre concentration was varied from 0.06 to 0.9 M in a 100-μl reaction. Mark: 1-kb DNA ladder (Invitrogen). (B) Without Tre. (C) Product yields at different Tre concentrations, duplicate measurements by PicoGreen assay (two times). (D) LBS (SI Text) of products at different Tre concentrations, and LBS of reference gDNA. The measurement was repeated (two times) for each amplicon, and multiply repeated (nine times) for the reference in different independent tests.

