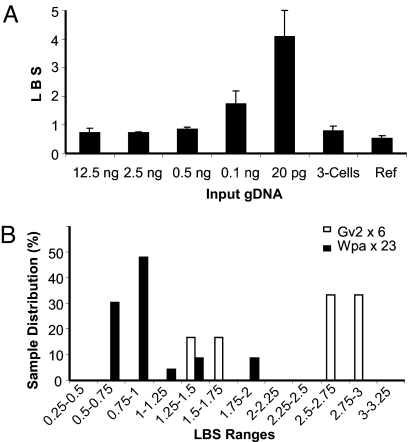
Fig. 3.
LBS of amplicons with different initial DNA inputs. (A) Different amounts of purified gDNA amplified with the general amplification procedure of Wpa (see Table S2 for detailed data). Each sample was repeated twice for qPCR LBS assessment (SI Text), and the mean was taken. (B) Direct amplification from a single to a few cells (2.8 ± 1.9 cells) with Wpa vs. Gv2. In total, 23 and 6 samples were amplified with Wpa and Gv2, respectively.

