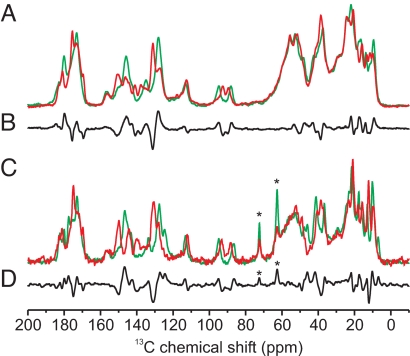
Fig. 4.
One-dimensional 13C CP/MAS NMR spectra of u-[13C, 15N]-PCB in Cph1Δ2 and phyA65 in the Pr (A and C, green, respectively) and Pfr (A and C, red, respectively) states, and the Pr-Pfr difference spectra in Cph1Δ2 and phyA65 are shown in B and D, respectively. Positive signals represent Pr, and negative signals represent Pfr. The asterisks indicate the position of the glycol signals in natural abundance.

